Official Documents (Bulgarian)
Ministry of Argriculture and Food - Reference, Certificate, User Manual covers and User Manual
THE SP-PAM APPLICATIONFUNCTIONALITY
Annual growth rings in trees could be used as an indicator for the complex impact of climate change on tree growth and forest communities. This impact could be easily measured from the width of the annual rings, the characteristics of the summer and the late wood, the density of the wood and other factors.
How SP-PAM works?
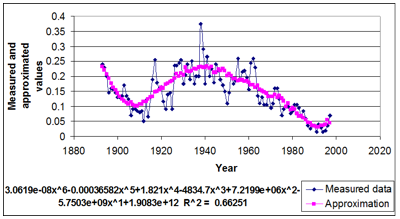
After their measurement ring width values are used as input for regression analysis. The aim is to find a polynomial that best approximates the data from this dendrochronological row. The criterion of proximity to the approximate polynomial initial data is set by the determination coefficient R2 ( 0 ≤ R2 ≤ 1 ) . Larger values of R2 mean better approximation.
After calculating the approximated values the growth indexes for each tree are calculated as a relation between the measured at the approximate value of ring width for each year.
The calculation of the growth index helps eliminate the age of the tree as a factor influencing the tree wing width.
When the index value is outside the range of the allowed interval for normal values the year it occurs for is said to be unfavorable for growth or stress year. The sequence of one or more adjacent stress years is perceived as stress period. Each stress period is defined by two years (margins) – beginning year (LB) and ending year (RB) for the sequence. When the stress period is consists of only one year the left and right margins are the same.
Functionality
The basic analysis implemented in SPPAM are based on the information related to locations and tree species sampled in these locations.
1.Polynomial approximation of series and selection of best approximation:
- Automatic generation of approximate polynomial of the greatest extent possible.
- Calculation of growth index (It) as the ratio between the measured and the estimated value for each year and row.
- Finding an average model row from It for individual localities per species (standardization of dendrohronological rows).
- Rows with R2 > 0.45 and correlation index r ≥ 0.1are present in the analysis
2. Calculation of EPS and rejection of localities with EPS < 80%
3. Multiple regression analysis of model index rows of widths, temperature and precipitation with intention to reveal the limiting factors for growth, type and localities
4. Identification of stress periods (SP) for individual species and localities – periods with It < 1 and of stress sections – In
5. Characteristic of identified In to find the most reliable stress-sections (intervals of years for various localities and types)– calculation of indicators of In: duration (D), amplitude (A) and frequency (F) – average and extreme values, coverage (Cov.) and cardinality (Card.) of stress sections. Stress sections with Cov. ≥ 50% take part in the analysis;
6. Polynomial approximation of climate data for temperatures and rainfall, and selection of the best approximation. Calculation of Itm, Ip
7. Finding the average temperatures and rainfall for 30 – year periods, and the confidence interval of the average climatic and biological climate years by localities. Calculating of av.T, dT, av. P and dP
8. Determination of adverse climatic and biological climatic years – AHD, AHW, ACD, ACW in both regimes and different combinations where one of the regimes is normal according to dT and dP
9. Parallel analysis of stress periods and climate data. Comparative analysis of the periods of stress sections with adverse years
Measured indicators
Growth index, It = MW/AW, where MW- measured and AW – calculated width for rows with confidence approximations (R² > 0.45).
Eustress duration (D) - numebr of consequent adverse years in a series.
Eustress frequency(F) - the number of stress years for a period of 100 years.
Eustress depth (A) - \(A = \frac{1}{2}\sum_{i=1}^{s}(1-It_{i})\) where Iti are the growth indexes, where eustress is established.
"К" - coefficients - ratio between the number of analyzed years and the number of stress years (SY).
Cardinality (Card.) - number of series with the same eustress years.
"Ct" - coefficient - ratio between Card. and the combined number of examined rows from one location (n).
Coverage (Cov.) – the ration between cardinality (Card.) and the number of examined rows that have the same periods.
Climatic year type (CY) – the deviation of the average annual temperature (Tavg.) of the climatic norms for temperature (dT) and the deviation of the average annual rainfall (Pavg.) of the climatic norms for precipitation (dP).
Climatic norms for temperature - Tavg ± μti for periods of 30 years.
Climatic norms for precipitation - Pavg. ± μpi for periods of 30 years.